How to Read a Heart Rate Monitor
Numbers flash across the screen—heart rate, rhythm, oxygen levels—but what do they actually mean for you? Whether you’re checking a fitness tracker during a workout or watching a loved one’s hospital monitor, knowing how to read a heart rate monitor transforms confusing data into life-saving insight. These devices reveal far more than beats per minute; they expose real-time clues about cardiovascular health, oxygen delivery, and emerging emergencies.
This guide teaches you to interpret readings from clinical monitors and consumer wearables alike. You will learn to distinguish heart rate from pulse, decode ECG waveforms, recognize dangerous rhythms, and respond appropriately to alarms. Everything here draws on verified medical standards so you can act with confidence.
Decode Heart Rate Numbers and Labels
Know the Difference Between HR and PR
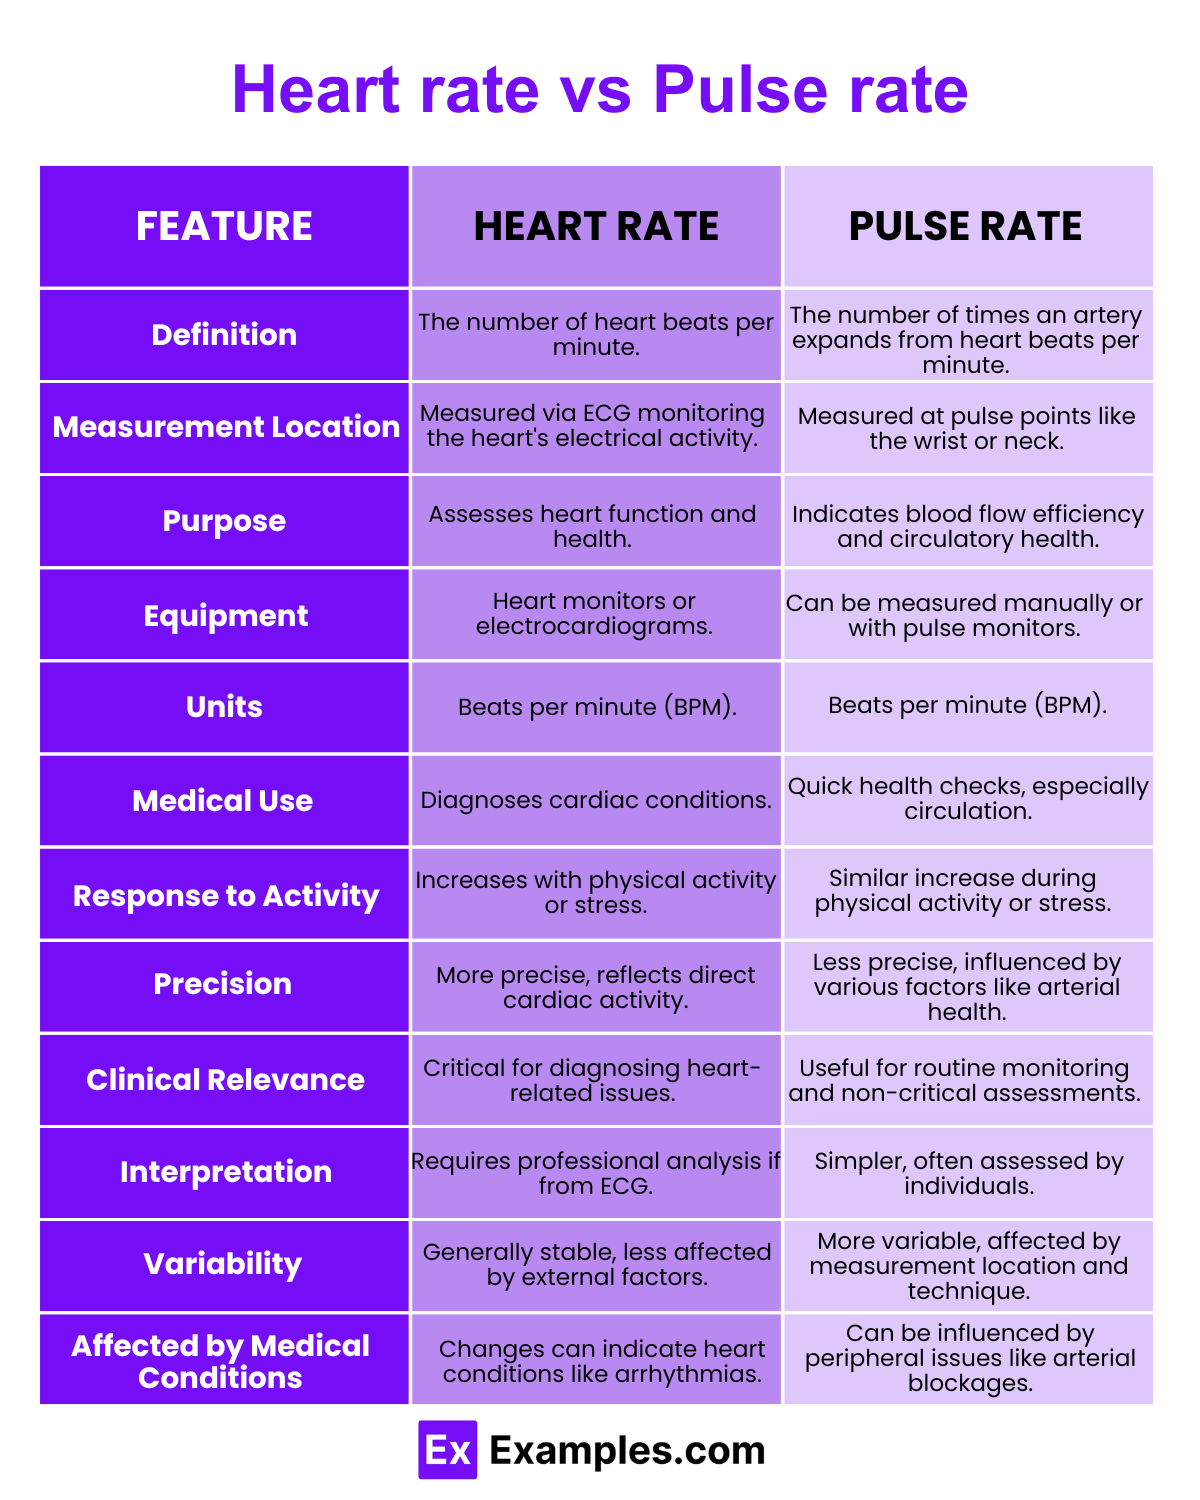
Every monitor displays two key values: HR (Heart Rate) and PR (Pulse Rate). Although they often match, they measure different things.
HR comes from the ECG and reflects electrical activity in the heart. PR is measured by a pulse oximeter on your finger and shows actual blood flow with each beat. In healthy individuals, HR equals PR. When PR drops below HR, you have a pulse deficit, which may signal atrial fibrillation or poor circulation. Always check both values when available.
Identify Normal and Abnormal Ranges
For most adults, a normal resting heart rate falls between 60 and 100 bpm. Highly fit athletes may show resting rates as low as 40 to 50 bpm because their hearts pump efficiently. Rates above 100 bpm indicate tachycardia, while rates below 60 bpm suggest bradycardia.
Context matters enormously. A heart rate of 140 bpm is normal for an infant but alarming in a resting adult. Dehydration, anxiety, fever, and infection can all push heart rates upward.
Recognize Color-Coded Displays
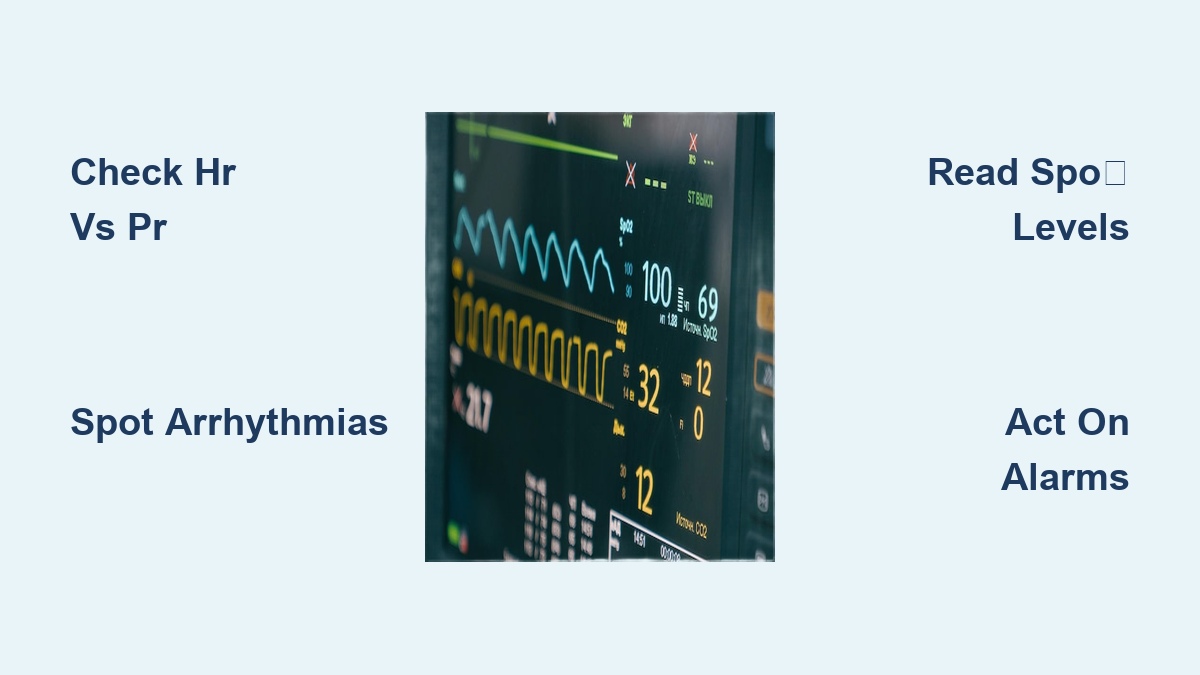
Most clinical monitors use a consistent color scheme. Heart rate appears in green, usually as large digits in the top right corner. Oxygen saturation shows in blue or cyan, while blood pressure displays in red or white. This visual coding helps you spot critical values instantly during emergencies.
Read ECG Waveforms for Rhythm Clues
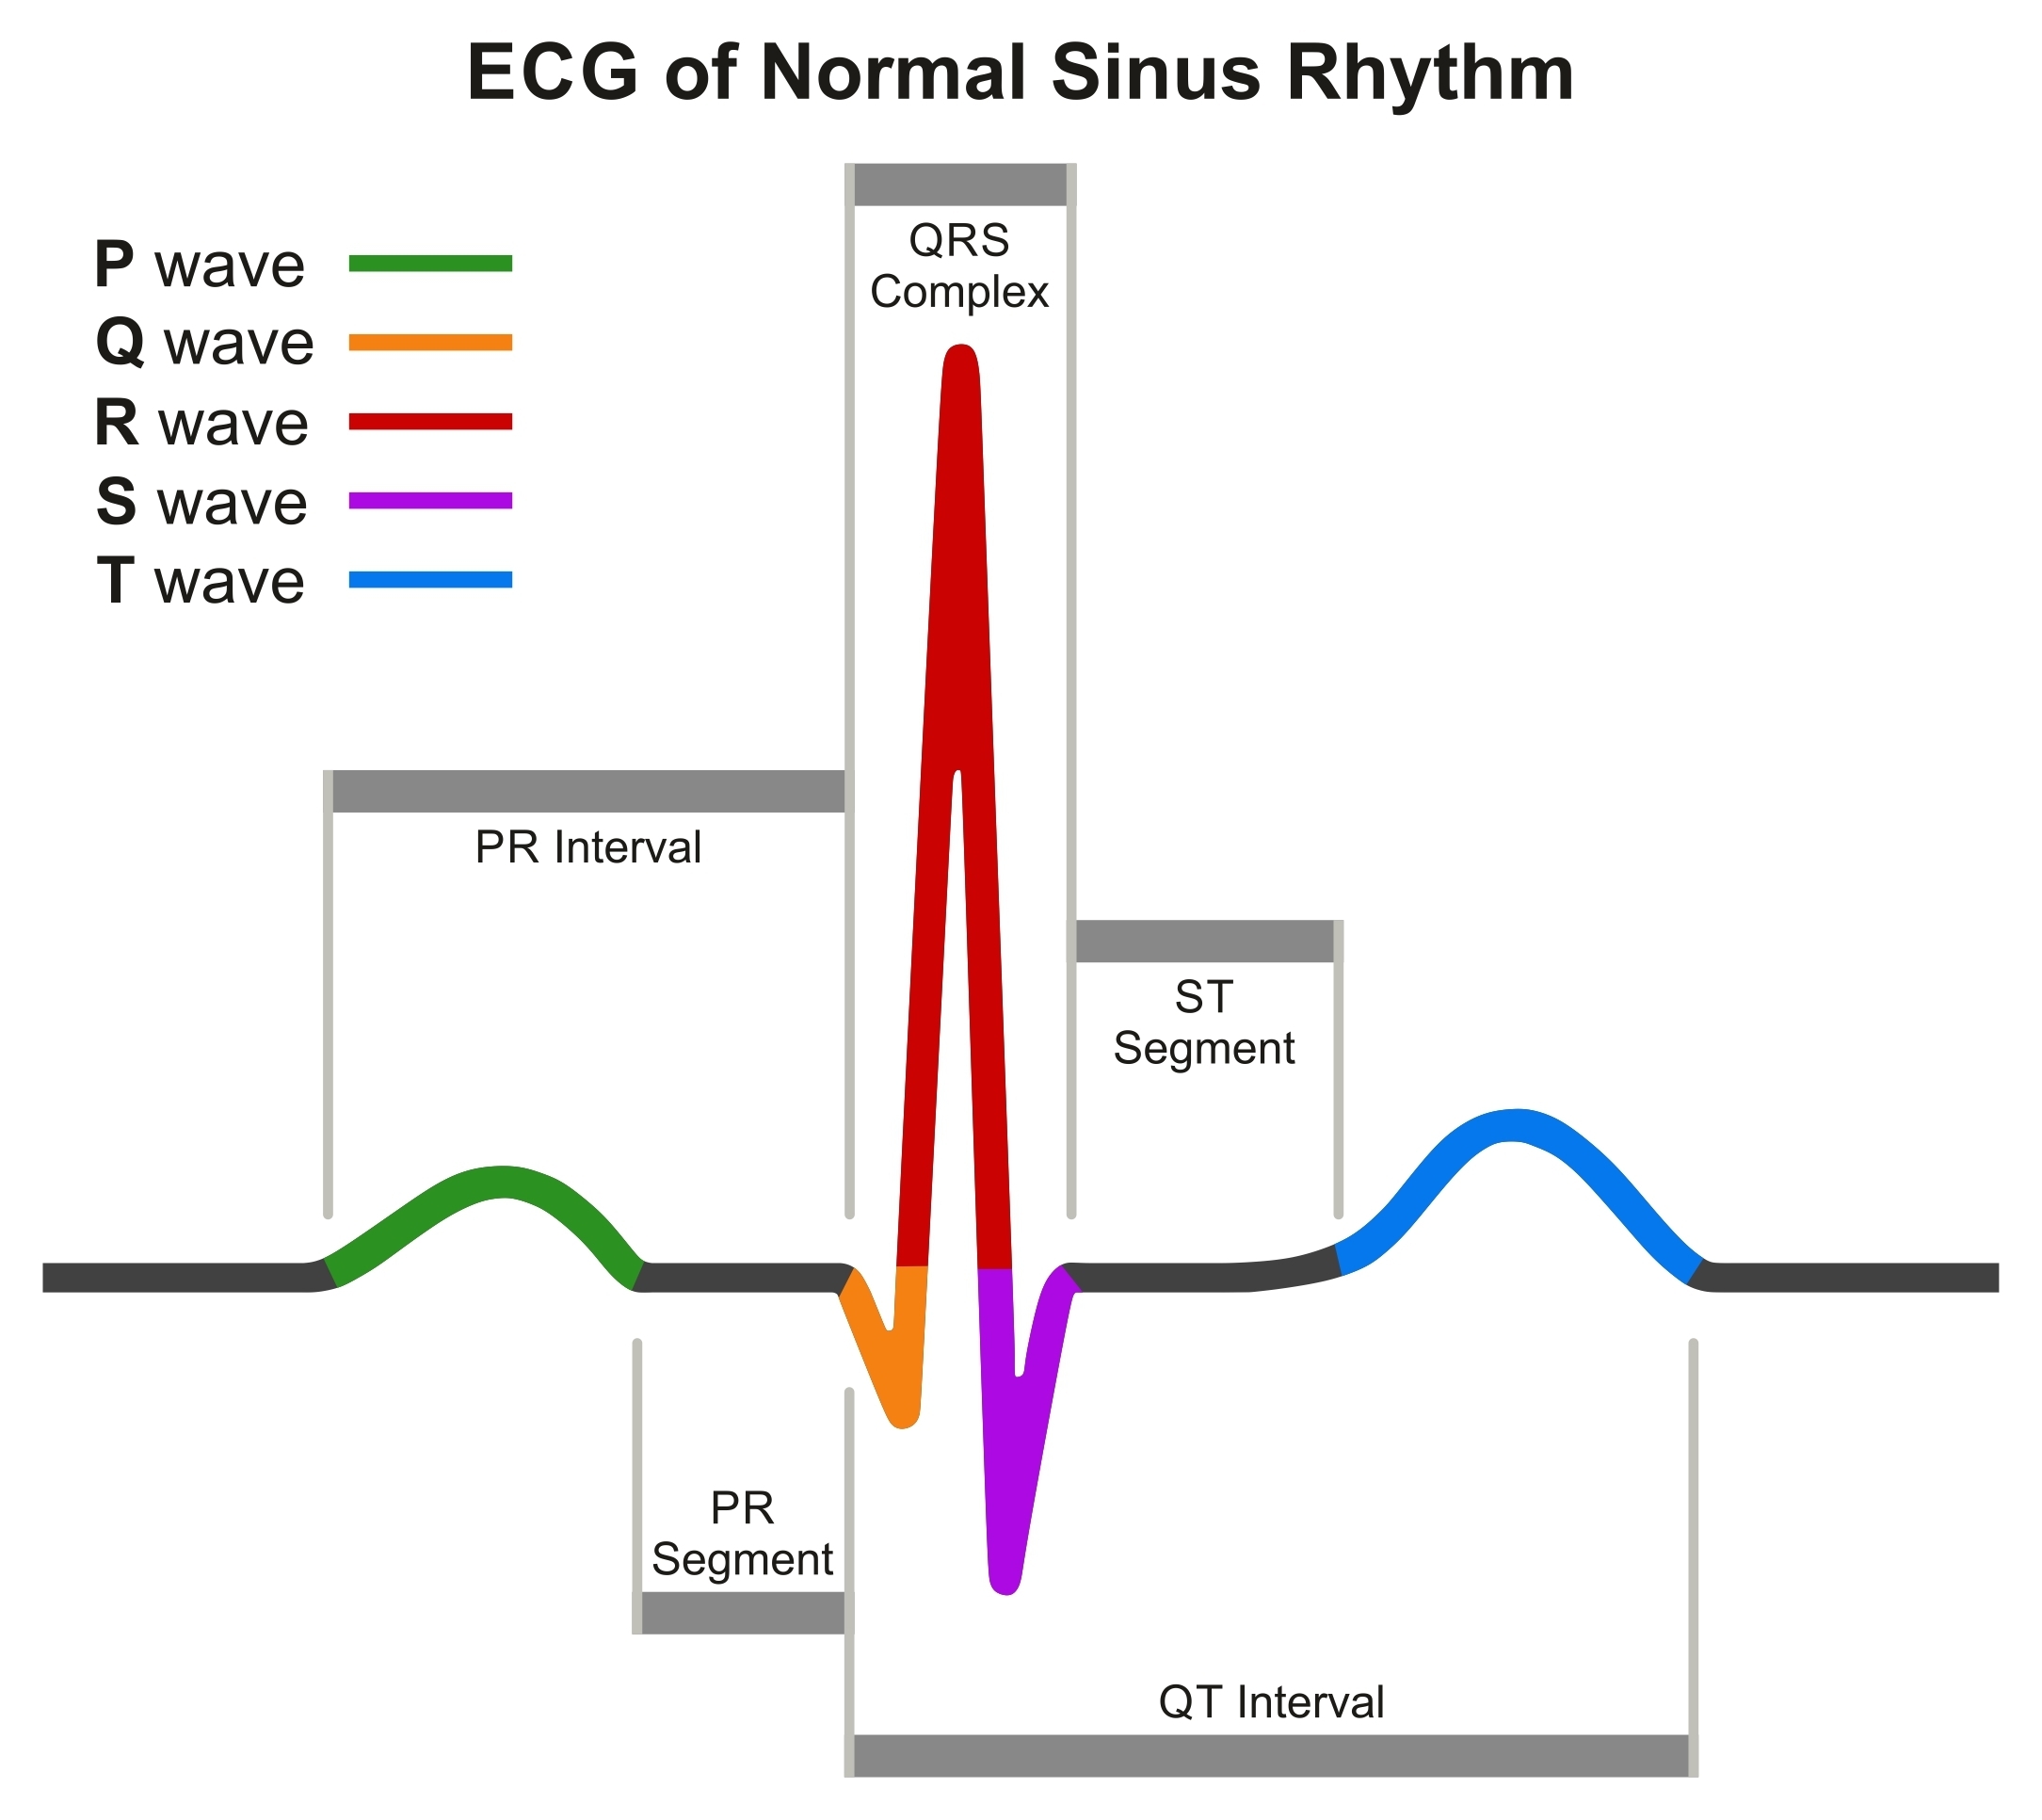
Understand the Basic ECG Pattern
Bedside monitors display a simplified rhythm strip, typically Lead II, that reveals your heart’s electrical activity. Three key components tell the story:
- P Wave: A small bump before the main spike, showing atrial contraction
- QRS Complex: The tall, sharp spike representing ventricular contraction (your actual heartbeat)
- T Wave: A small hump after the spike indicating ventricular recovery
A regular, repeating P-QRS-T sequence means normal sinus rhythm.
Spot Dangerous Rhythms
Atrial Fibrillation appears as an “irregularly irregular” rhythm with no visible P waves and a chaotic baseline. Heart rate often exceeds 100 bpm, and stroke risk climbs significantly.
Ventricular Fibrillation shows as a wavy line with no clear spikes. The heart quivers instead of pumping, which is cardiac arrest requiring immediate defibrillation. Always assess the patient first, since movement or seizures can mimic this pattern.
Atrial Flutter creates a distinctive “sawtooth” pattern that doctors sometimes mistake for sinus tachycardia.
Calculate Heart Rate from the ECG Strip
Use the 300 method for quick estimates. Count the number of large squares between R waves (the tall spikes), then divide 300 by that number. Four large squares between beats equals 75 bpm. This works best for regular rhythms.
Interpret Pulse Oximeter Readings and Waveform

What SpO₂ Tells You
SpO₂ measures the percentage of hemoglobin carrying oxygen. Normal values range from 95% to 100%. Readings below 90% indicate hypoxemia and may require supplemental oxygen. COPD patients often have a lower baseline target of 88% to 92% to avoid carbon dioxide retention.
Always cross-check SpO₂ with physical symptoms. Shortness of breath, confusion, or bluish lips demand urgent care even if the number looks acceptable.
Check the Plethysmograph Waveform
The wavy line below the SpO₂ number shows perfusion quality, meaning how well blood reaches your extremities. Strong, consistent peaks indicate good circulation. Flat, jagged, or absent waves suggest poor perfusion, cold hands, or a loose sensor.
Each peak should align with a heartbeat on the ECG. If the ECG shows 80 bpm but the plethysmograph shows no pulse, you have a pulse deficit or shock.
Avoid Common Reading Errors
SpO₂ readings falter due to nail polish (especially dark colors), cold fingers, poor sensor placement, bright ambient light, and motion. Remove nail polish, warm the patient’s hands, and keep still for accurate results.
Understand Blood Pressure Readings on Monitors
:max_bytes(150000):strip_icc()/HDC-How-To-Read-a-Blood-Pressure-Chart-Including-Low-High-and-Normal-Readingscopy-6543ec020e564dea85e675225d9f3049.png)
Break Down the Two Numbers
Blood pressure appears as two numbers: systolic over diastolic (for example, 120/80 mmHg). Systolic measures pressure when the heart beats. Diastolic measures pressure when the heart rests between beats. Elevated systolic pressure increases stroke and heart attack risk.
Know the Stages of Hypertension
| Category | Systolic | Diastolic | Action |
|---|---|---|---|
| Normal | Below 120 | Below 80 | Maintain healthy lifestyle |
| Elevated | 120 to 129 | Below 80 | Monitor and reduce salt |
| Stage 1 HTN | 130 to 139 | 80 to 89 | Lifestyle changes plus possible medication |
| Stage 2 HTN | 140 or higher | 90 or higher | Medication required |
| Crisis | Above 180 | Above 120 | Call 911 immediately |
When systolic and diastolic fall into different categories, the higher category wins. A reading of 144/88 qualifies as Stage 2 Hypertension.
Detect False Readings and Artifacts
A sudden drop to 60/40 followed by normal readings may reflect a transient event or a measurement error from a loose cuff or arm positioned below heart level. For best results, keep the arm at heart level, sit quietly for five minutes beforehand, and avoid caffeine, smoking, or exercise for 30 minutes prior. Trends matter more than single readings.
Monitor Respiratory Rate and Temperature
Don’t Trust Automated Readings Alone
Respiratory rate is one of the earliest warning signs of deterioration, yet automated monitors frequently misread it. Normal adult respiratory rate falls between 12 and 20 breaths per minute. Rates above 20 suggest tachypnea from pain, fever, or respiratory distress. Rates below 12 suggest bradycardia from sedation or neurological issues.
Always verify manually by watching the chest rise for 30 seconds and doubling the count.
Interpret Temperature Correctly
Normal body temperature ranges from 97.8°F to 99.1°F (36.5°C to 37.3°C). Fever begins above 100.4°F (38°C), while hypothermia occurs below 95°F (35°C). Recent hot or cold drinks and improper probe placement skew results. Older adults may not develop fever during infection, so watch for confusion or weakness instead.
Respond to Alarms Safely and Quickly
Prioritize the Patient Over the Machine
The golden rule: if the monitor signals ventricular fibrillation but the patient is alert and talking, you are seeing a false alarm. Loose ECG leads, patient movement, and poor sensor contact cause most false alerts. Always assess the person first, then troubleshoot the equipment.
Classify Alarm Types
Physiological alarms trigger when values exceed safe limits, such as heart rate above 100, SpO₂ below 90%, or apnea detected. These require clinical judgment about whether the change is new or worsening.
Technical alarms indicate sensor disconnection, low battery, or signal loss. Fix connections first by repositioning wires or replacing batteries.
Follow a Five-Step Response
- Look at the patient. Check breathing, consciousness, and color.
- Check leads and sensors for secure attachment and warm fingers.
- Verify readings against manual measurements like pulse checks.
- Review trends to distinguish single spikes from genuine deterioration.
- Escalate immediately if abnormalities persist or the patient looks unwell.
Never ignore alarms, even frequent false ones.
Use At-Home Devices Accurately
Prepare Properly for Reliable Readings
For home blood pressure or heart rate monitors, sit with your back supported and feet flat on the floor. Keep your arm at heart level. Avoid coffee, nicotine, and exercise for 30 minutes before measuring. Empty your bladder, since a full bladder raises readings. Stay still and silent throughout.
Take two to three readings one minute apart and record the average.
Log Data for Better Diagnosis
Keep a simple log with date, time, blood pressure, heart rate, medications, symptoms, and activity level. This record helps doctors diagnose white coat hypertension and detect hidden patterns that single readings miss.
Know When to Seek Emergency Help
Seek immediate medical attention if blood pressure exceeds 180/120 mmHg on two readings, even without symptoms. Chest pain, shortness of breath, or confusion also require urgent care. A resting heart rate consistently above 120 or below 50 warrants professional evaluation.
Avoid Common Mistakes When Reading Monitors
Misreading Age-Specific Norms
A heart rate of 140 bpm is normal for a six-month-old but dangerous for an adult. Always consider age-specific ranges. Newborns typically show 100 to 160 bpm, toddlers 90 to 150 bpm, and school-age children 70 to 120 bpm.
Confusing Motion Artifact with Arrhythmia
Shivering, tremors, and agitation create jagged lines that mimic ventricular fibrillation or tachycardia. Re-secure leads, warm the patient, and confirm with physical assessment before assuming a dangerous rhythm.
Ignoring the Perfusion-Pulse Gap
When ECG shows 100 bpm but pulse oximeter shows 70 bpm, the heart is not pumping effectively. This pulse deficit commonly appears in atrial fibrillation and demands urgent attention.
Overlooking Trend Changes
One high reading causes less concern than a steady rise over hours. Track changes to catch deterioration early.
Frequently Asked Questions About Heart Rate Monitors
What is a dangerous heart rate on a monitor?
A resting heart rate above 100 bpm (tachycardia) or below 60 bpm (bradycardia) may indicate a problem in non-athletic adults. Seek immediate care if the rate exceeds 120 bpm or drops below 50 bpm at rest, especially with symptoms like dizziness or chest pain.
How accurate are wrist heart rate monitors compared to chest straps?
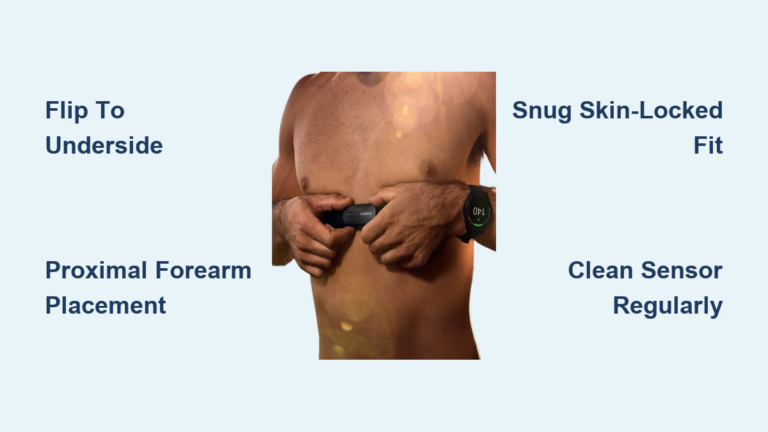
Wrist monitors using optical sensors are convenient but less accurate during intense movement or irregular rhythms. Chest straps reading electrical activity typically provide more reliable data during exercise and for clinical purposes.
Why does my pulse oximeter reading keep dropping?
Common causes include cold fingers, motion, nail polish, poor sensor placement, or weak peripheral circulation. Warm your hands, remove polish, keep still, and reposition the sensor. Persistent low readings below 90% require medical evaluation.
Can a heart rate monitor detect a heart attack?
Monitors can detect arrhythmias and significant changes but cannot definitively diagnose a heart attack. Chest pain, shortness of breath, and pressure radiating to the arm or jaw require emergency evaluation regardless of monitor readings.
What does it mean when HR and PR don’t match?
A gap between heart rate (electrical) and pulse rate (mechanical) indicates a pulse deficit. This often signals atrial fibrillation or poor circulation and warrants medical assessment.
How often should I check my heart rate at home?
For general fitness, periodic checks during rest and exercise suffice. For managing conditions like hypertension or atrial fibrillation, follow your doctor’s guidance, typically once or twice daily at consistent times.
Final Thoughts on Reading Heart Rate Monitors
Understanding how to read a heart rate monitor empowers you to make informed health decisions. Remember that HR and PR should match, with a gap suggesting arrhythmia or poor perfusion. Normal adult heart rate falls between 60 and 100 bpm, though athletes and infants differ significantly. ECG waveforms help identify atrial fibrillation, ventricular fibrillation, and flutter patterns. SpO₂ below 90% signals hypoxemia and demands fast action. Blood pressure above 180/120 constitutes a hypertensive crisis requiring emergency services. Automated respiratory rates are unreliable, so always verify manually. Alarms require a patient-first response rather than blind trust in the screen.
Whether you are monitoring recovery at home or supporting a loved one in the hospital, consistent logging and proper preparation produce the most useful data. Stay alert, verify findings with physical assessment, and never hesitate to seek professional help when something feels wrong. Your ability to interpret these numbers could make the critical difference in an emergency.