Does Whoop Monitor Heart Rate?
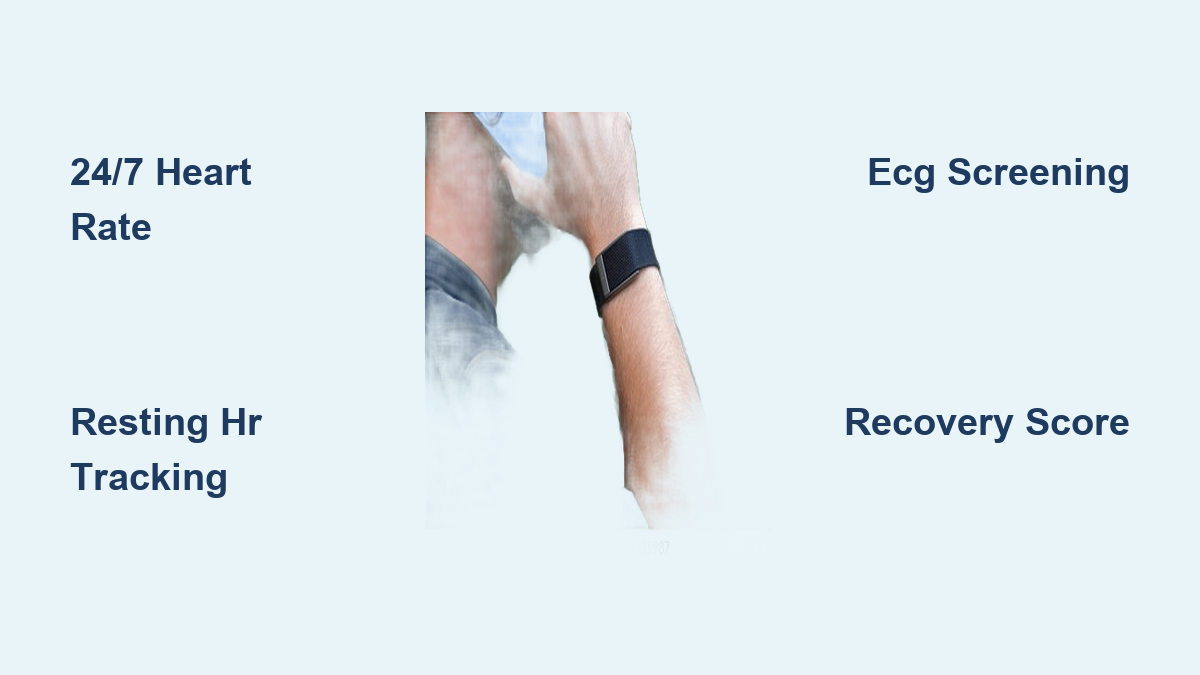
Yes, WHOOP continuously monitors heart rate using advanced optical sensors that capture data every second, 24 hours a day. This constant tracking goes far beyond simple beat counting, powering insights like Recovery Scores, Daily Strain, Sleep Stages, and even early warnings for potential cardiac issues. At the core of the system is photoplethysmography (PPG) technology, which uses green LED lights to detect blood flow changes beneath your skin in real time.
In this guide, you’ll learn exactly how WHOOP measures heart rate, what metrics it calculates from that data, and how you can use those insights to improve training, recovery, and long-term health. Whether you’re an athlete optimizing performance or simply want a clearer picture of your cardiovascular wellness, understanding WHOOP’s heart rate capabilities is the first step.
Continuous 24/7 Heart Rate Tracking
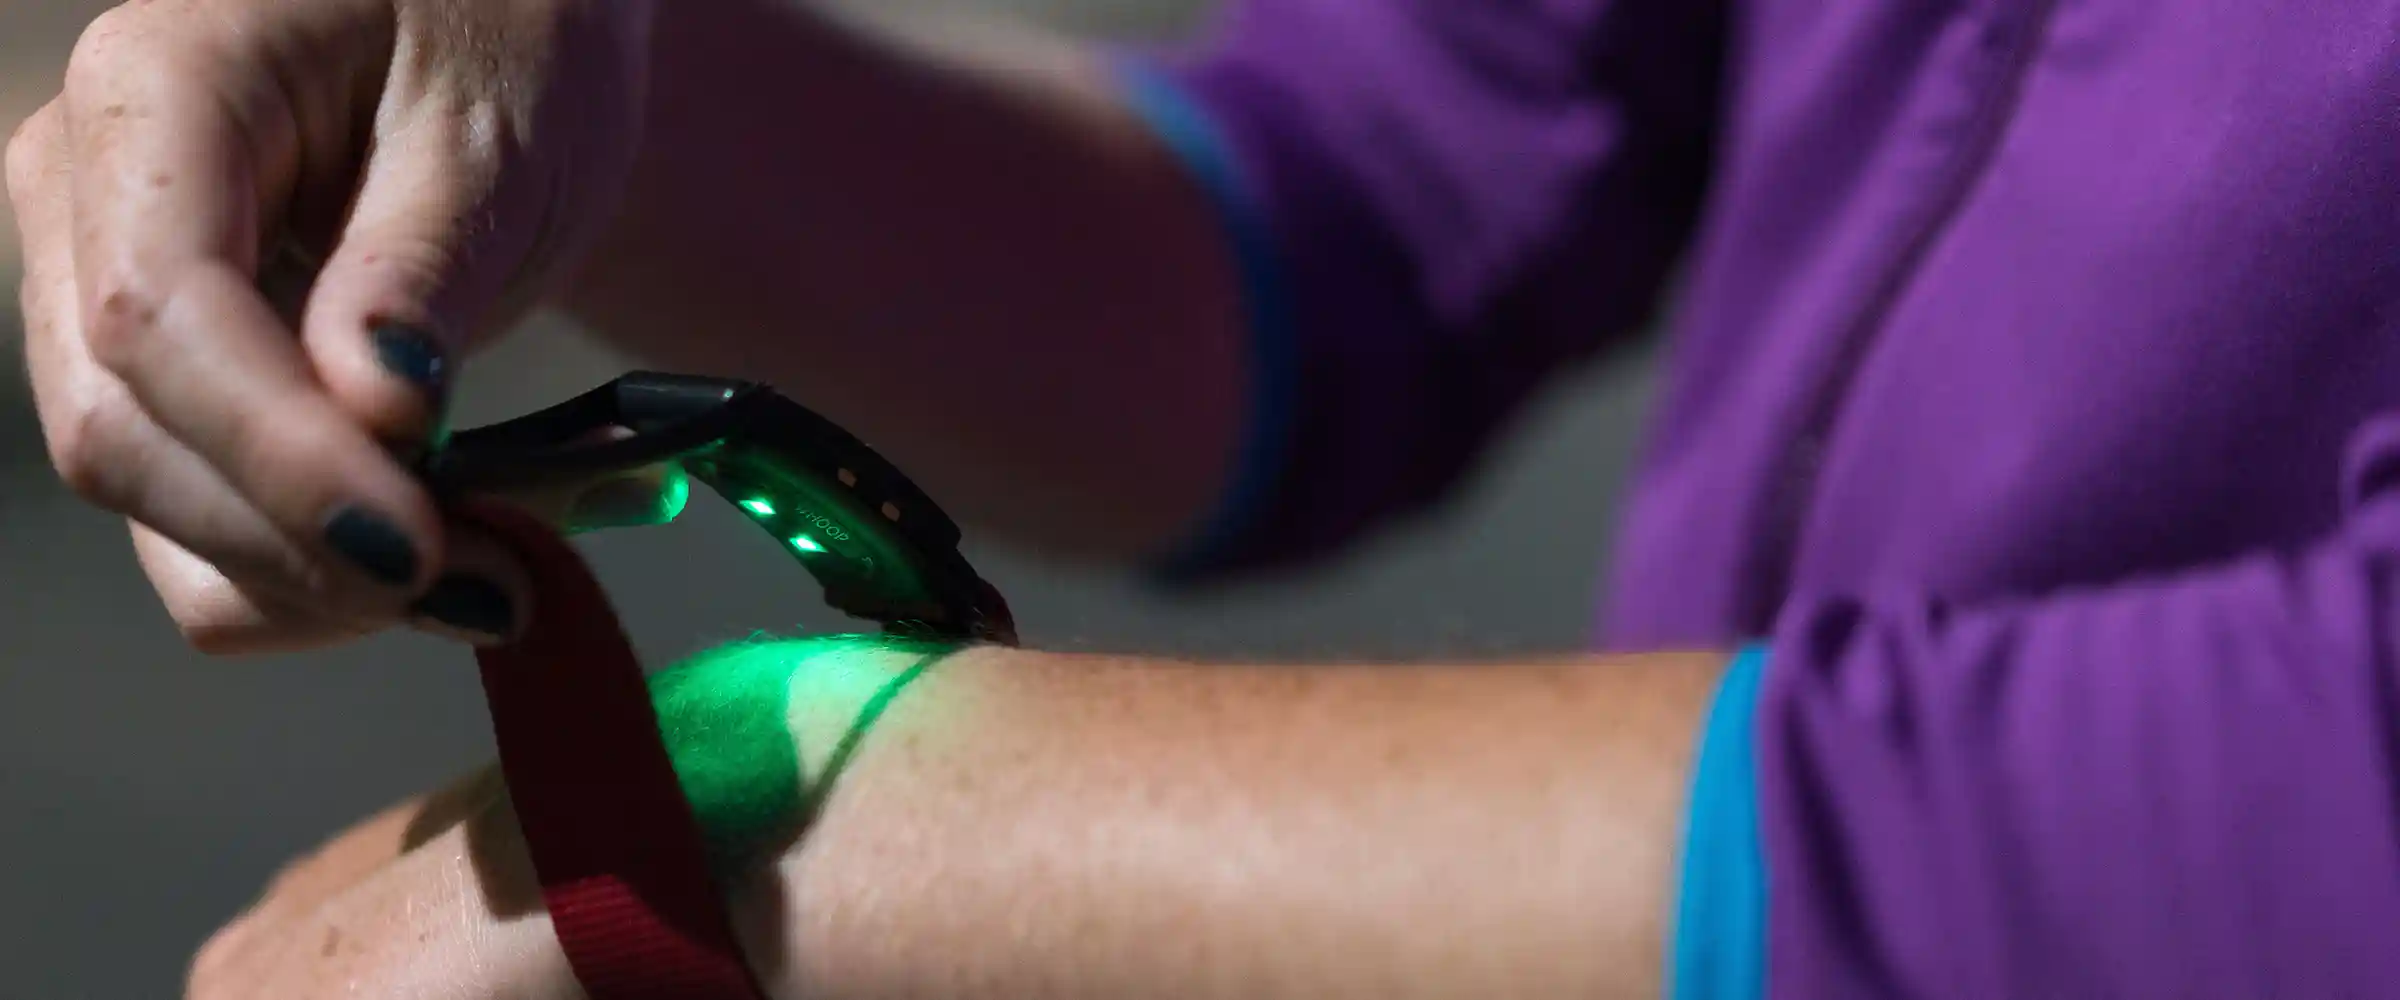
WHOOP captures heart rate data every single second, day and night. This persistent monitoring creates a complete picture of your cardiovascular activity across all states: intense exercise, daily movement, relaxation, and deep sleep. Unlike devices that sample intermittently, WHOOP’s constant data stream ensures no physiological shift goes unnoticed.
The device uses PPG technology, where green LED lights penetrate the skin to measure blood volume changes with each heartbeat. These micro-variations in light reflection convert into precise heart rate values through proprietary algorithms. Because the sensor runs nonstop, it can detect subtle patterns like a rising resting heart rate before illness symptoms appear or delayed recovery after a hard workout.
Wearing WHOOP 24/7 is essential for accuracy. Removing the device, even briefly, creates data gaps that disrupt trend analysis and recovery calculations. WHOOP offers charging solutions that let you stay connected while powering up, ensuring seamless data continuity.
Real-Time vs. Resting Heart Rate
WHOOP distinguishes between real-time exertion and resting physiology. During activity, live heart rate shows how hard your body is working, feeding directly into your Daily Strain score. At rest, especially during sleep, it calculates Resting Heart Rate (RHR), a key indicator of cardiovascular fitness and recovery status.
A lower RHR typically reflects better aerobic conditioning. Over time, consistent training should gradually reduce your average RHR. Conversely, spikes in RHR may signal dehydration, stress, poor sleep, or illness. WHOOP flags these deviations so you can investigate lifestyle factors logged in your Journal, such as alcohol intake, caffeine, or travel.
Because RHR is most accurate during stable sleep periods, WHOOP pulls this metric primarily from nighttime data. Morning readings are also influenced by sleep quality and duration, making them highly sensitive to recovery needs.
Motion Noise Reduction During Workouts
One challenge with optical heart rate sensors is motion interference during high-intensity activities like running or HIIT. Arm movement can distort light signals, leading to inaccurate spikes or drops.
WHOOP combats this with advanced motion noise separation algorithms. Updated in February 2026, the system now more effectively filters out movement artifacts while preserving true peak heart rates. This ensures that when you hit max effort, your Strain score reflects actual exertion, not sensor error.
The algorithm leverages both accelerometer data and historical heart rate trends to distinguish between motion and pulse. As a result, users experience fewer false readings during dynamic movements, improving reliability for serious athletes who depend on precise zone training.
Personalized Health Monitoring Dashboard
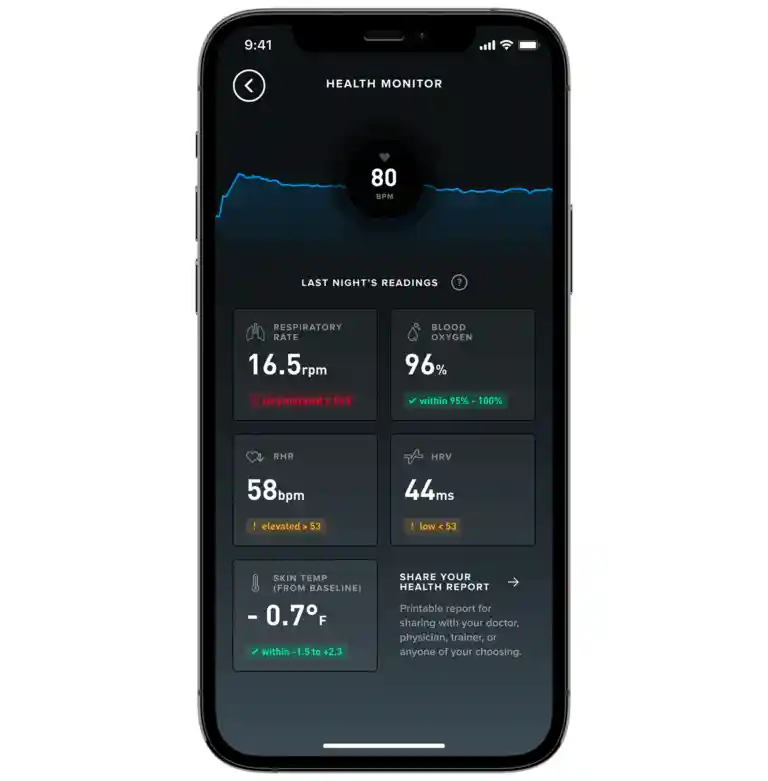
WHOOP’s Health Monitor gives you a centralized, real-time view of your key biometrics, all compared to your personal baseline. Instead of generic thresholds, it highlights changes relative to you, making trends easier to interpret and act on.
This dashboard integrates multiple metrics collected overnight: Resting Heart Rate, Heart Rate Variability (HRV), Respiratory Rate, Blood Oxygen (SpO2), and Skin Temperature. Each metric is color-coded: green means within your normal range; orange or red indicates a meaningful deviation.
These alerts aren’t diagnoses. They’re prompts to reflect on recent behaviors. Did you drink late last night? Skimp on sleep? Catch a bug? The Health Monitor helps connect lifestyle choices to physiological outcomes.
Baseline-Driven Alerts, Not Population Averages
WHOOP builds your baseline over time by analyzing weeks of continuous data. This individualized approach is more sensitive than population-based norms. For example, a “normal” respiratory rate for adults is 12–20 breaths per minute, but WHOOP knows your typical range might be 14–16.
When deviations occur, the system flags them early. One documented case showed a user whose RHR and respiratory rate rose steadily over several days. Standard pulmonary tests found nothing abnormal because they used population averages. But WHOOP’s personalized tracking revealed a hidden trend, later confirmed by CT scan to be cryptogenic organizing pneumonia. After treatment, the metrics returned to the user’s personal baseline.
This power lies in longitudinal tracking. A single day’s outlier isn’t cause for alarm, but multi-day trends provide actionable intelligence, especially useful during perimenopause, illness, or intense training blocks.
Interpreting Color-Coded Metric Changes
- Green (Checkmark): Metric is within your established range. No action needed.
- Orange (Exclamation): Slight deviation. Consider recent habits like poor sleep, alcohol, or stress.
- Red (Exclamation): Significant deviation. May indicate fatigue, infection, or hormonal shifts.
For instance, if HRV drops and RHR rises simultaneously, it often signals poor recovery. You might want to scale back training or prioritize sleep. If skin temperature stays elevated for multiple nights, it could align with ovulation or the onset of illness.
Always cross-reference alerts with your Journal entries. WHOOP doesn’t know you had three glasses of wine; you do. Pairing subjective input with objective data creates a powerful feedback loop for self-awareness.
Advanced Cardiac Screening with ECG
WHOOP goes beyond optical heart rate tracking with on-demand ECG (electrocardiogram) via the Heart Screener feature, available exclusively to WHOOP Life members using a WHOOP MG device. This adds medical-grade electrical signal analysis to detect irregular heart rhythms like Atrial Fibrillation (AFib).
While PPG tracks blood flow, ECG measures the heart’s electrical impulses directly. This allows for more precise rhythm classification, especially useful for identifying arrhythmias that may not be detectable through optical means alone.
The feature supports early detection of AFib, the most common cardiac arrhythmia, linked to increased risks of stroke, heart failure, and cognitive decline. Early identification enables timely medical consultation and intervention.
How to Use On-Demand ECG
Using the Heart Screener takes just 30 seconds:
- Open the WHOOP app and go to the Health tab.
- Tap Heart Screener.
- Place your thumb and index finger on the metal sensor indents of the WHOOP clasp.
- Hold still until the reading completes.
After 30 seconds, you’ll receive a detailed report indicating either Normal Sinus Rhythm or Possible Atrial Fibrillation. Results are stored in your history and can be exported as a PDF to share with your doctor.
No extra hardware is needed; the sensors are built into the clasp. However, only the WHOOP MG model supports this feature due to enhanced electrode design and firmware capabilities. The feature is available for users 22 years and older.
Understanding ECG Results
- Normal Sinus Rhythm: Your heart’s upper and lower chambers are beating in coordinated rhythm. This is the expected, healthy pattern.
- Possible Atrial Fibrillation: The electrical activity is irregular, suggesting disorganized atrial contractions. This requires follow-up with a healthcare provider.
A single “Possible AFib” result is not a diagnosis. False positives can occur due to movement, poor contact, or temporary rhythm changes. However, repeated detections should prompt medical evaluation.
WHOOP’s ECG algorithm has undergone years of development and clinical validation to meet regulatory standards. Still, it’s not intended for users with known non-AFib arrhythmias or implanted devices like pacemakers or ICDs.
Sharing Reports with Your Doctor
One of WHOOP’s most valuable tools is the ability to export data. After any ECG scan, you can generate a PDF report containing the waveform, timestamp, and interpretation.
Similarly, you can create a 30-day or 180-day Health Report summarizing trends in RHR, HRV, sleep, and other metrics. These reports are formatted for clinical readability, helping doctors spot patterns they might miss in short office visits.
This feature empowers proactive health management. Instead of saying “I feel off,” you can show objective data: “My HRV dropped 30% over five nights, RHR increased, and I had two possible AFib alerts.”
Five Personalized Heart Rate Zones
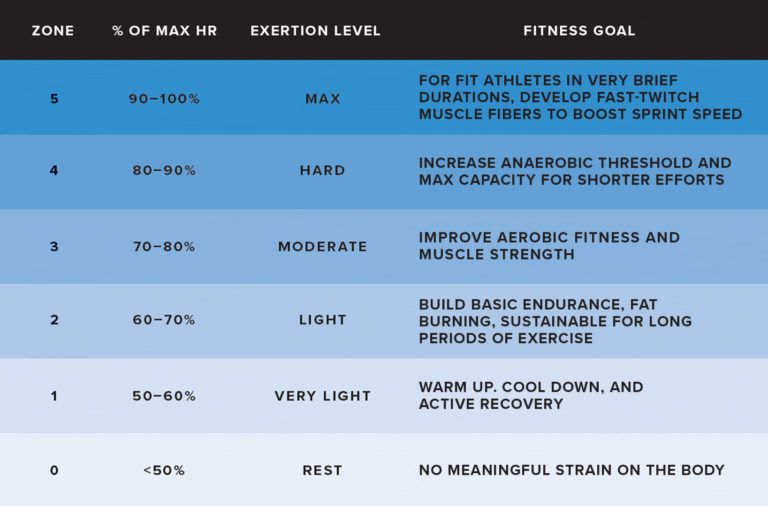
WHOOP divides your heart rate range into five zones based on your actual maximum heart rate (MHR), not age-based estimates. This personalization ensures training intensity is accurate and effective.
Most formulas estimate MHR as 220 minus age. But research shows this can be off by ±10–20 bpm. WHOOP improves accuracy by dynamically adjusting your MHR based on real workout data over time. If you consistently reach higher heart rates during sprints, your zones will update accordingly.
These zones power WHOOP’s Strain system, helping you balance effort and recovery. Each zone corresponds to a level of exertion and physiological adaptation.
| Zone | % of Max HR | Purpose |
|---|---|---|
| Zone 1 | 50–60% | Active recovery |
| Zone 2 | 60–70% | Aerobic base building |
| Zone 3 | 70–80% | Tempo and threshold work |
| Zone 4 | 80–90% | Anaerobic capacity |
| Zone 5 | 90–100% | Max power and speed |
Zone-Specific Training Benefits
- Zone 1 (Recovery): Promotes blood flow without adding strain. Ideal post-hard workout or on rest days.
- Zone 2 (Endurance): Builds aerobic efficiency. Most long runs should occur here to maximize fat utilization and mitochondrial development.
- Zone 3 (Tempo): Improves lactate threshold. Feels comfortably hard; you can speak in short phrases.
- Zone 4 (Threshold): Increases anaerobic capacity. Requires full focus; speaking is difficult.
- Zone 5 (Max): Develops speed and neuromuscular power. Reserved for short intervals of 30–60 seconds.
Training in the right zone prevents undertraining or overreaching. Many runners spend too much time in Zone 3, too hard to be truly aerobic, too easy to build speed. WHOOP helps avoid this “gray zone” trap.
Polarized Training Strategy
The most effective endurance training follows a polarized model: roughly 80% of training time in Zones 1–2, and 20% in Zones 4–5. Minimal time is spent in Zone 3.
Example weekly structure:
– 3–4 easy runs in Zone 1–2
– 1–2 interval sessions in Zones 4–5
– 1 tempo run in Zone 3 (optional)
This approach maximizes aerobic gains while minimizing fatigue. WHOOP’s Strain Target feature guides this balance by suggesting daily exertion levels based on your Recovery score.
If recovery is green, you’re encouraged to hit Zone 4–5. If yellow or red, the app nudges you toward Zones 1–2 to prevent burnout.
Factors That Affect Heart Rate
Many variables influence your heart rate beyond effort level:
– Hydration: Even mild dehydration raises HR.
– Temperature: Heat and humidity increase cardiac load.
– Caffeine: Can elevate resting and exercise HR.
– Stress and Sleep: Poor recovery increases HR at any given pace.
– Illness: Infection often causes elevated RHR before symptoms appear.
WHOOP accounts for these by tracking context. If your HR is higher than usual during an easy run, the app may suggest checking sleep quality or hydration, helping you adjust in real time.
Core Performance and Recovery Metrics
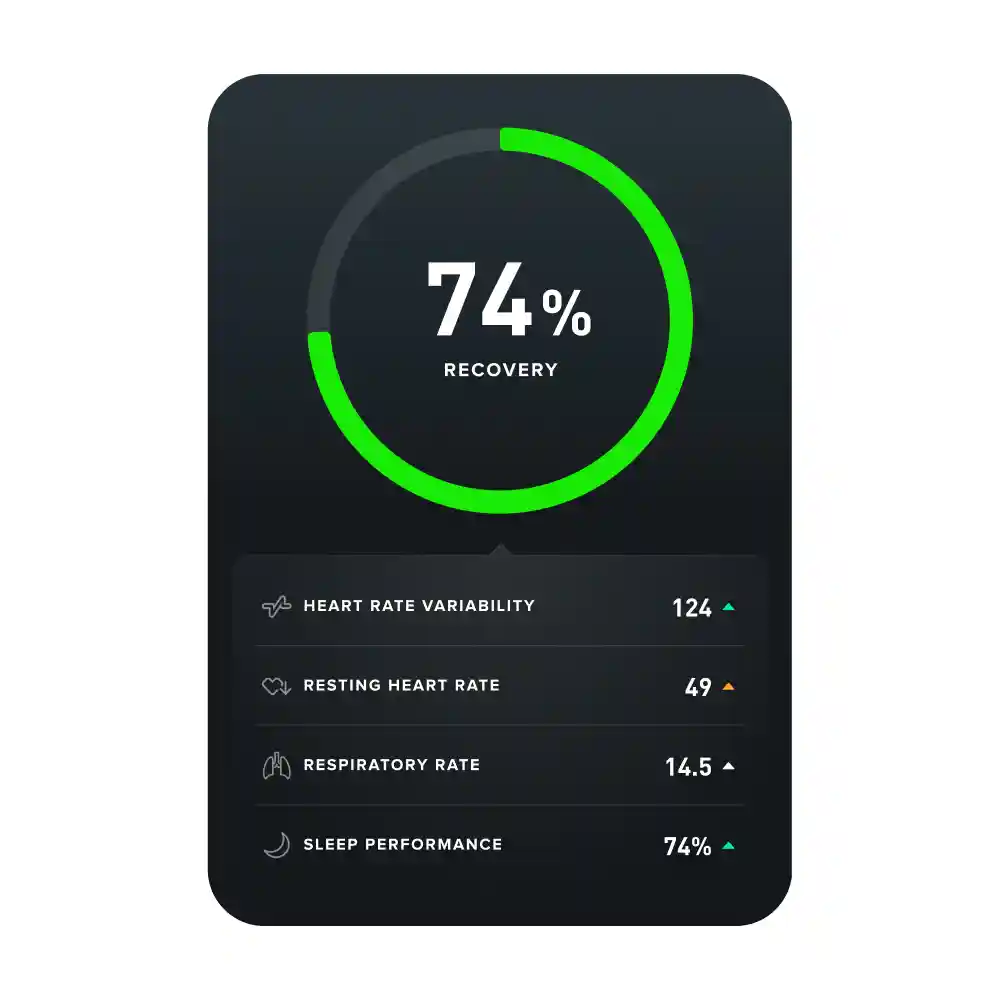
Heart rate data fuels WHOOP’s flagship metrics: Daily Strain and Recovery Score. Together, they form a feedback loop for sustainable performance.
Daily Strain: Measure Your Cardio Load
Strain quantifies cardiovascular exertion on a 0–21 scale, with 10 representing a moderate day. It’s calculated using time spent in each heart rate zone, weighted by intensity.
For example:
– 60 minutes in Zone 2 equals roughly 8 Strain
– 30 minutes in Zone 5 equals roughly 14 Strain
The system adjusts for fitness level; what’s hard for one person may be easy for another. Over time, you’ll learn your optimal Strain range based on how your body responds.
Elite athletes often aim for 15–20 on hard days, while beginners may top out at 10–12. The key is consistency and alignment with recovery.
Recovery Score: Guide Your Effort
Your Recovery score (0–100%) predicts readiness for strain. It’s calculated using:
– HRV (40%)
– Resting Heart Rate (30%)
– Sleep Performance (30%)
High HRV and low RHR equal high recovery. Disrupted sleep or elevated RHR equals lower recovery.
The score determines your Strain Recommendation:
– Green (90–100%): Go hard. Push into Zones 4–5.
– Yellow (60–89%): Moderate effort. Stick to Zones 2–3.
– Red (below 60%): Prioritize recovery. Stay in Zone 1 or rest.
This prevents overtraining and supports long-term progress.
Frequently Asked Questions About WHOOP Heart Rate Monitoring
Does WHOOP monitor heart rate continuously?
Yes. WHOOP captures heart rate data every second, 24 hours a day, using PPG optical sensor technology. This continuous tracking covers workouts, daily activities, sleep, and rest periods.
Can WHOOP detect heart problems?
WHOOP’s on-demand ECG feature (Heart Screener) can detect Possible Atrial Fibrillation in users 22 and older with a WHOOP MG device and WHOOP Life membership. It’s not a diagnostic tool, but it can flag irregular rhythms that warrant medical follow-up.
How accurate is WHOOP’s heart rate monitor?
WHOOP uses advanced algorithms updated in February 2026 to improve motion noise separation and preserve true peak heart rates. Testing includes diverse participants across ages, body types, fitness levels, and skin tones to ensure reliability in real-world conditions.
Does WHOOP track resting heart rate?
Yes. Resting Heart Rate is calculated primarily from nighttime sleep data and displayed in the Health Monitor. It’s a key input for the Recovery score and helps identify trends related to fitness, stress, or illness.
What devices support WHOOP heart rate monitoring?
WHOOP 4.0, 5.0, and MG devices all support continuous heart rate tracking. The on-demand ECG feature requires the WHOOP MG model specifically.
Can I share my WHOOP heart rate data with my doctor?
Yes. You can export ECG readings as PDFs immediately after a scan, or generate 30-day or 180-day Health Reports summarizing trends in RHR, HRV, sleep, and other metrics. These reports are formatted for clinical readability.
Key Takeaways for Understanding WHOOP Heart Rate Monitoring
WHOOP does monitor heart rate, continuously, accurately, and intelligently. From real-time workout feedback to early health warnings via ECG, it transforms raw biometrics into actionable insights that adapt to your unique physiology.
The most important points to remember:
– WHOOP captures heart rate every second using PPG optical sensors
– Heart rate data powers Recovery Scores, Daily Strain, Sleep Stages, and personalized training zones
– The on-demand ECG feature (WHOOP MG + Life membership) adds medical-grade rhythm analysis for users 22 and older
– Personalized baselines make WHOOP’s alerts more meaningful than generic population averages
Your next step: wear your WHOOP consistently for 30 days to establish a reliable baseline, then review your Health Monitor each morning to connect daily choices with measurable physiological outcomes.