How to Build a Heart Rate Monitor
You’ve probably used a smartwatch or fitness tracker that measures your heart rate, but have you ever wondered how it actually works and whether you could build one yourself? The good news: building a heart rate monitor is not only possible with basic electronics, but it is also a rewarding project for hobbyists, students, and makers. Whether you aim for a simple fingertip sensor or a wearable ECG device, this guide walks you through every step from choosing sensors to programming algorithms.
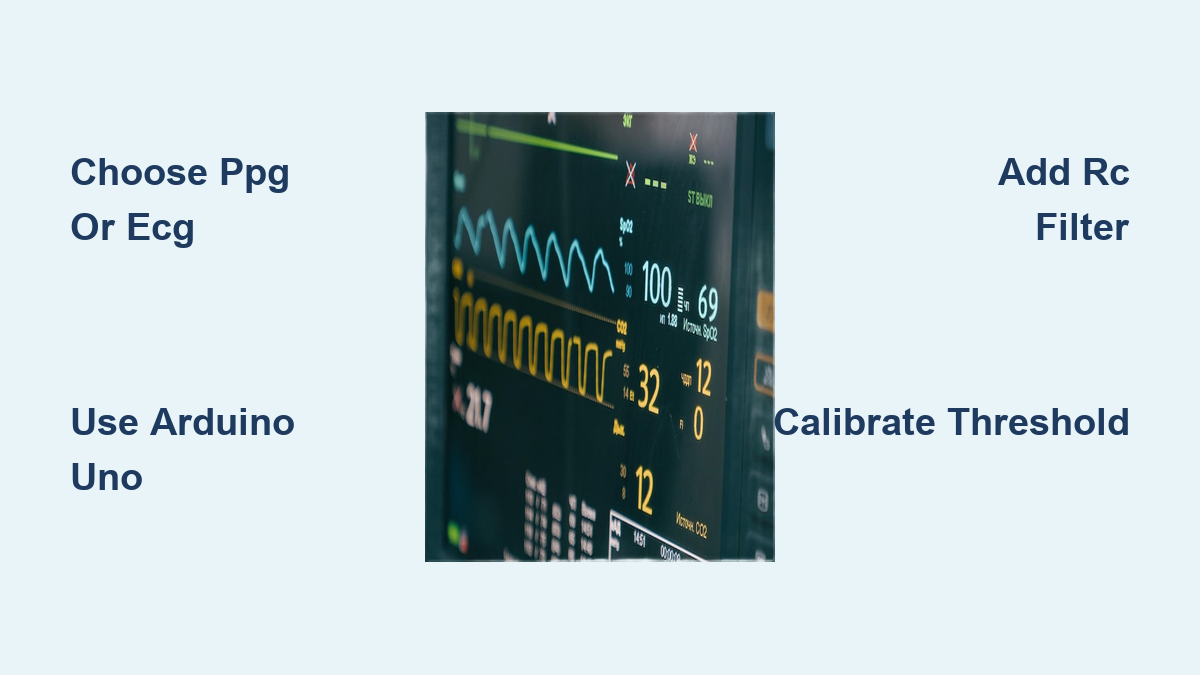
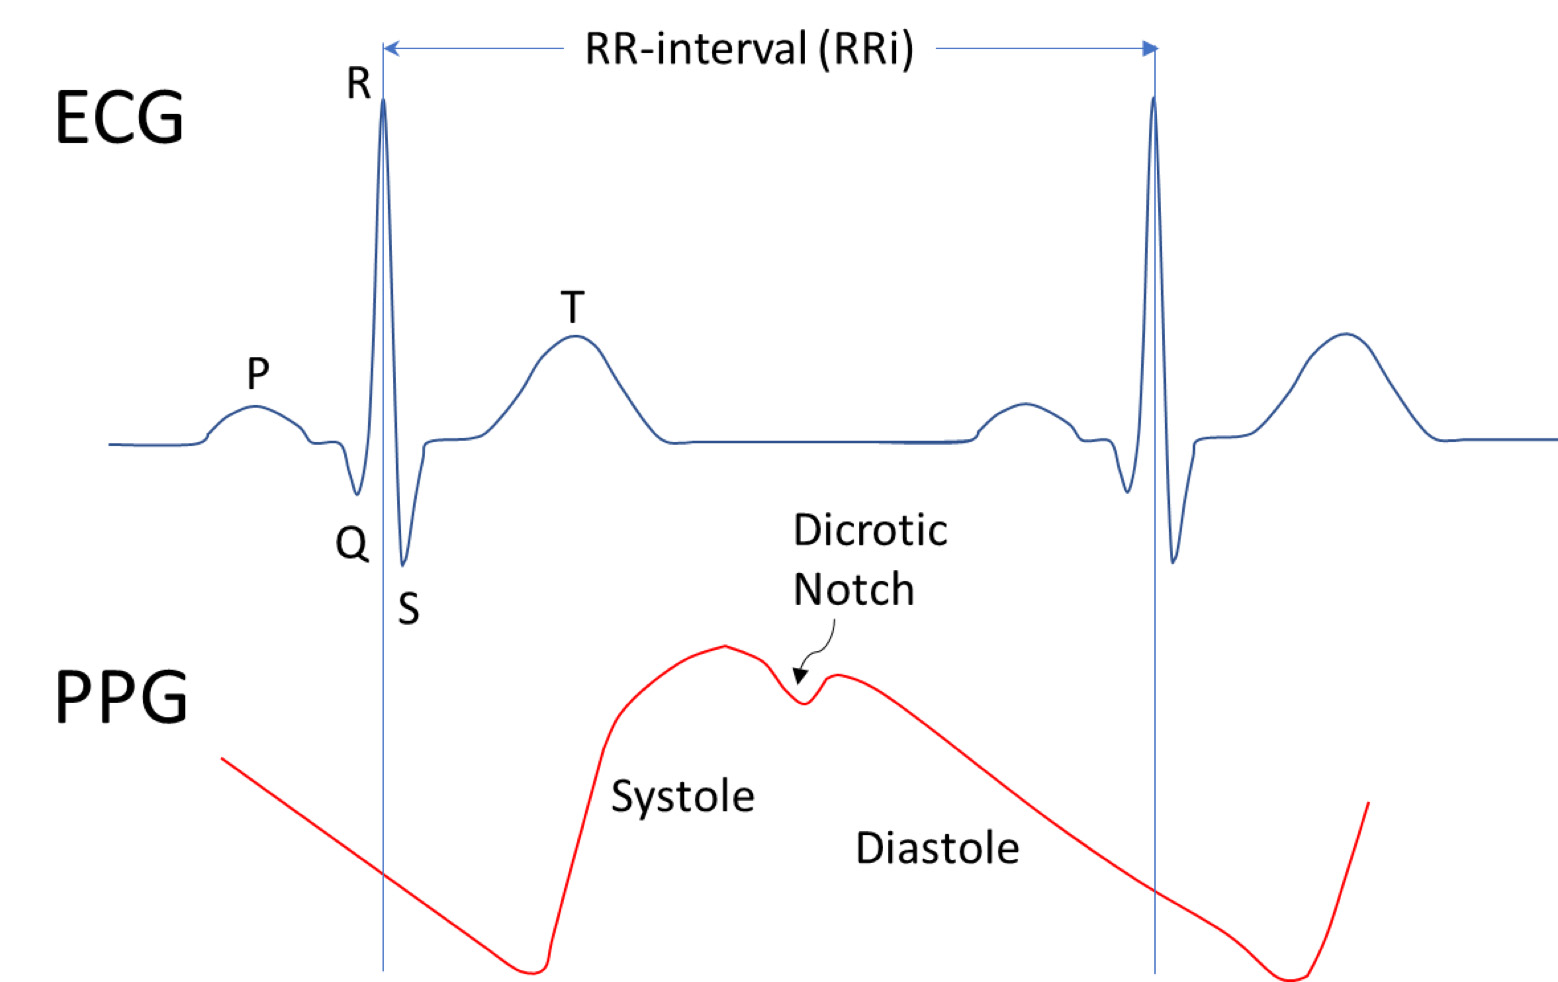
At the core of every heart rate monitor is the ability to detect blood flow or electrical activity tied to each heartbeat. Two primary technologies make this possible: photoplethysmography (PPG) and electrocardiography (ECG). PPG uses light to detect blood volume changes under the skin, making it ideal for DIY fingertip or wrist sensors. ECG measures the heart’s electrical signals and offers higher accuracy, commonly used in medical-grade chest straps. This guide focuses on Arduino-based builds and covers both optical and electrical sensing methods.
Choose Your Sensing Technology
Understand PPG vs ECG Methods
Photoplethysmography (PPG) relies on green LEDs and photodiodes. When light penetrates the skin, blood absorbs green wavelengths. As the heart pumps, blood volume in capillaries fluctuates, changing the amount of reflected light. A sensor detects these variations and converts them into an analog signal.
This method powers most consumer wearables and is perfect for beginner-friendly builds like fingertip clips or wristbands. It is non-invasive and easy to integrate but can be affected by motion or ambient light.
Electrocardiography (ECG) captures the heart’s electrical impulses through electrodes placed on the skin. These signals travel through the body and are picked up by sensors like the AD8232 module, which amplifies and filters the tiny voltages generated by cardiac activity.
ECG delivers medical-grade precision and is less prone to motion artifacts than PPG, but requires direct skin contact via electrode pads and careful circuit design to avoid interference.
Match Sensor to Use Case
| Application | Best Sensor Type | Notes |
|---|---|---|
| Fitness tracker | PPG (optical) | Lightweight, low power, wearable |
| Medical alert system | ECG | High accuracy, detects arrhythmias |
| Infant monitor | PPG or ECG | Non-intrusive design critical |
| Research prototype | Either | Depends on required data fidelity |
For first-time builders, start with a PPG-based optical pulse sensor. It is simpler to wire, program, and test. Once you master signal processing, move to ECG for advanced projects.
Select Your Core Components
Pick the Right Microcontroller
Your microcontroller processes raw sensor data and calculates BPM. Here are the top choices:
- Arduino Uno R3: Ideal for benchtop prototypes. Easy to program and debug.
- LilyPad Arduino: Designed for wearable electronics. Sewable pins work with conductive thread.
- Raspberry Pi: An alternative for projects requiring internet connectivity (IoT) or complex data logging.
- ESP32 or ESP8266: Best for IoT-enabled monitors. Built-in Wi-Fi lets you send data to phones or cloud services.
For beginners, Arduino Uno is recommended due to extensive community support and plug-and-play compatibility.
Source Essential Hardware
You will need more than just a board. Key components include:
- Optical Pulse Sensor (e.g., SEN-11574) or AD8232 ECG Module
- Breadboard and jumper wires for prototyping
- Power source: DC wall adapter, 9V battery, or USB power bank
- Output devices: LED, buzzer, or OLED display
- Resistors and capacitors: 1kΩ resistor and 0.1μF capacitor for noise filtering
For wearable versions:
– Conductive thread and needles
– Fabric patches or wristbands
– Small lithium polymer (LiPo) battery
– Alligator clips for temporary sewable connections
Upgrade Path: Custom PCB
Once your breadboard design works, consider a custom printed circuit board (PCB) for durability and miniaturization. Use free tools like KiCad to design layouts, then etch or order boards online. A custom PCB reduces wire clutter, improves reliability, and makes your build look professional.
For etching at home, you will need a copper-clad board, ferric chloride solution, glossy paper and a laser printer (or permanent markers), a soldering iron set to approximately 300°C (572°F), and a hand drill with 0.8mm to 1mm bits.
Wire the Sensor Circuit
Connect an Optical Pulse Sensor
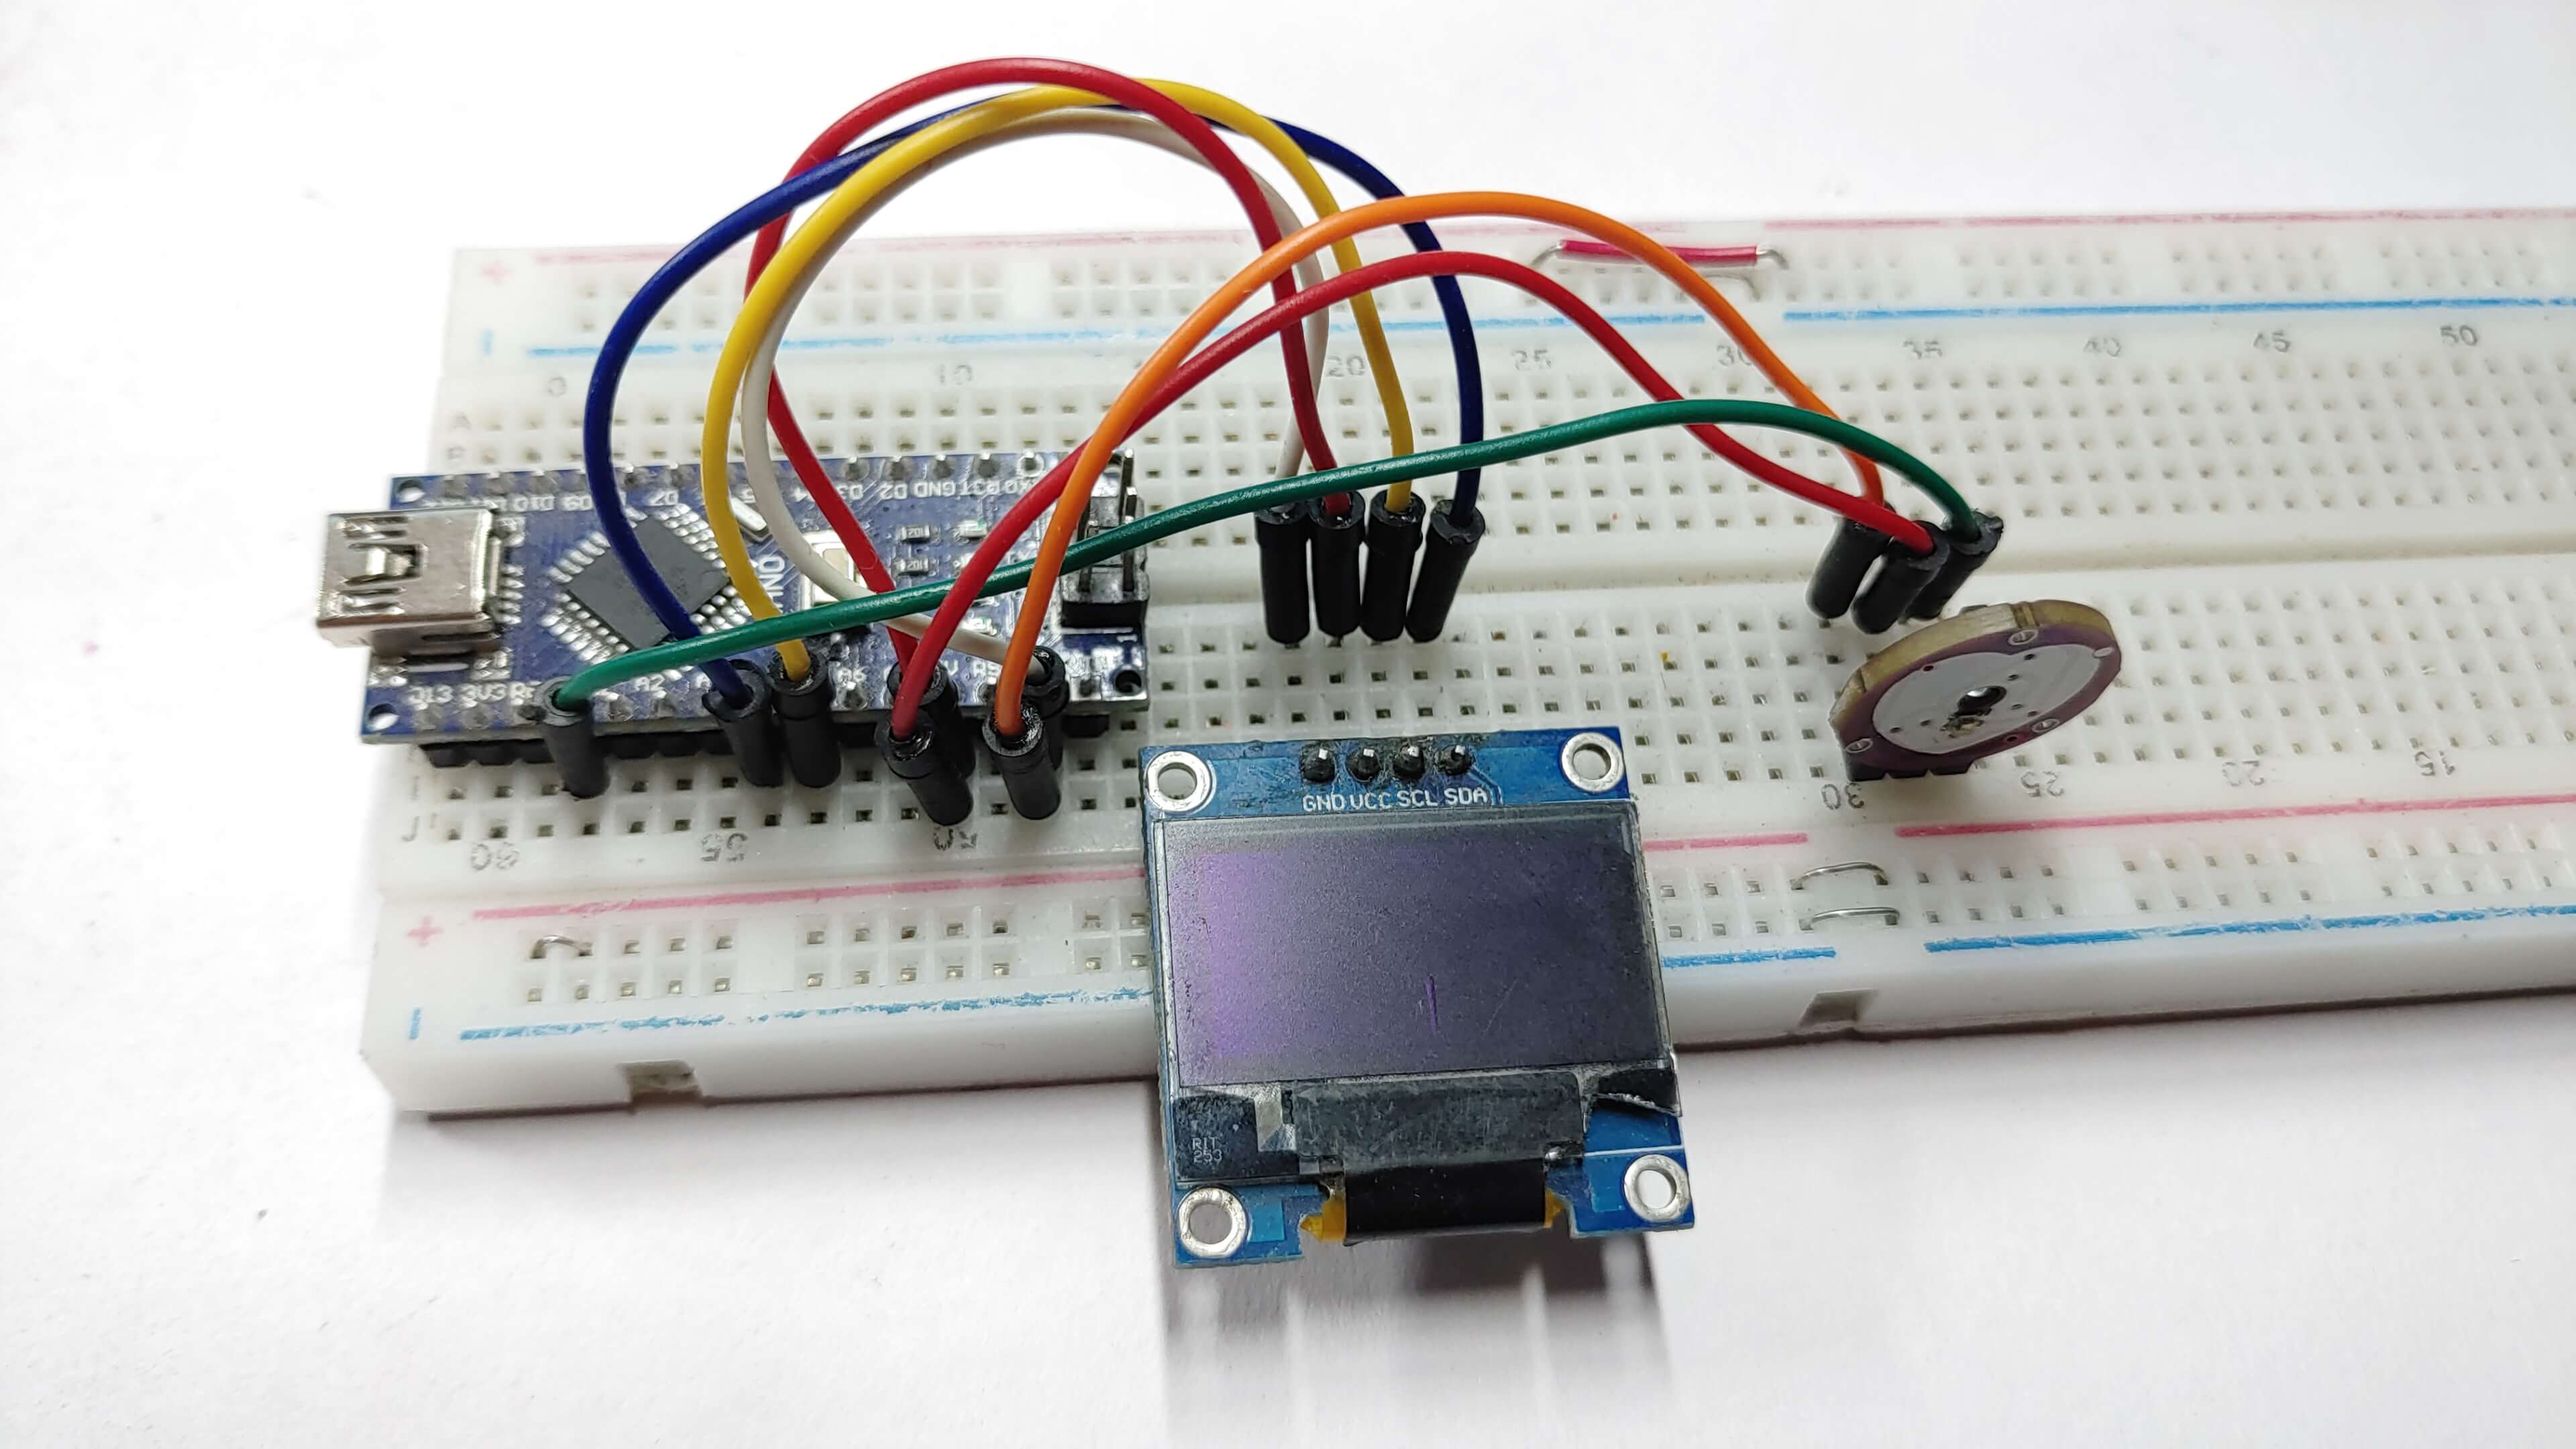
Use this configuration for fingertip or earlobe sensors:
| Sensor Pin | Arduino Connection |
|---|---|
| VCC | 5V |
| GND | GND |
| Signal | A0 (Analog In) |
Add a noise filter: Solder a 1kΩ resistor in series with the signal line and a 0.1μF capacitor from signal to ground. This RC filter removes high-frequency interference that can distort readings.
Tip: Wrap the sensor and finger in electrical tape to block ambient light. This dramatically improves signal quality.
Set Up an ECG Module (AD8232)
The AD8232 amplifies weak heart signals. Wire it as follows:
| AD8232 Pin | Arduino Connection | Function |
|---|---|---|
| VCC | 5V | Power Supply |
| GND | GND | Ground |
| OUT | A0 | Analog Output |
| RST | Not Connected | Reset (can be pulled high via resistor if needed) |
| LED | Not Used | Optional status indicator |
Critical setup steps:
– Solder male headers to both boards if not pre-attached.
– Use sticky electrode pads with firm skin contact.
– Place electrodes on the chest or torso. Avoid bony areas.
Warning: Never use ECG sensors near water or with damaged insulation. Always disconnect when not in use.
Program the Heart Rate Algorithm
Install Required Libraries
Open the Arduino IDE, go to Sketch > Include Library > Manage Libraries, and install pulse sensor libraries to simplify signal processing. These libraries include example sketches that handle much of the heavy lifting.
Read Analog Input and Detect Peaks
The Arduino’s 10-bit ADC provides analog values from 0 to 1023. Every heartbeat creates a spike in the sensor signal. The code must:
- Read analog values from pin A0
- Identify rising edges that exceed a threshold (typically 550–600 on the analog scale)
- Measure time between peaks
- Calculate BPM using: BPM = 60 / (seconds between beats)
Here is a simplified logic flow:
“`cpp
const int sensorPin = A0;
int threshold = 550; // Adjust based on testing
unsigned long lastBeat = 0;
int sensorValue = 0;
int peak = 0;
void setup() {
Serial.begin(9600);
}
void loop() {
sensorValue = analogRead(sensorPin);
if (sensorValue > threshold && peak == 0) {
long interval = millis() – lastBeat;
if (interval > 300) { // Ignore rapid false triggers
float bpm = 60000.0 / interval;
Serial.print(“BPM: “);
Serial.println(bpm);
lastBeat = millis();
peak = 1;
}
}
if (sensorValue < threshold) {
peak = 0;
}
delay(10);
}
“`
Calibrate the Threshold
Threshold values vary by person and lighting. Test with multiple users and adjust the threshold between 500–700 for optimal detection. Print raw values to the Serial Monitor to visualize the waveform and fine-tune.
Add Real-Time Feedback
Blink an LED with Each Beat
Connect an LED (with 220Ω resistor) to digital pin 13. Modify the code:
“`cpp
const int ledPin = 13;
// Inside loop(), after detecting a beat:
digitalWrite(ledPin, HIGH);
delay(50);
digitalWrite(ledPin, LOW);
“`
Now the LED flashes in sync with your heartbeat, providing satisfying visual confirmation.
Display BPM on an OLED Screen
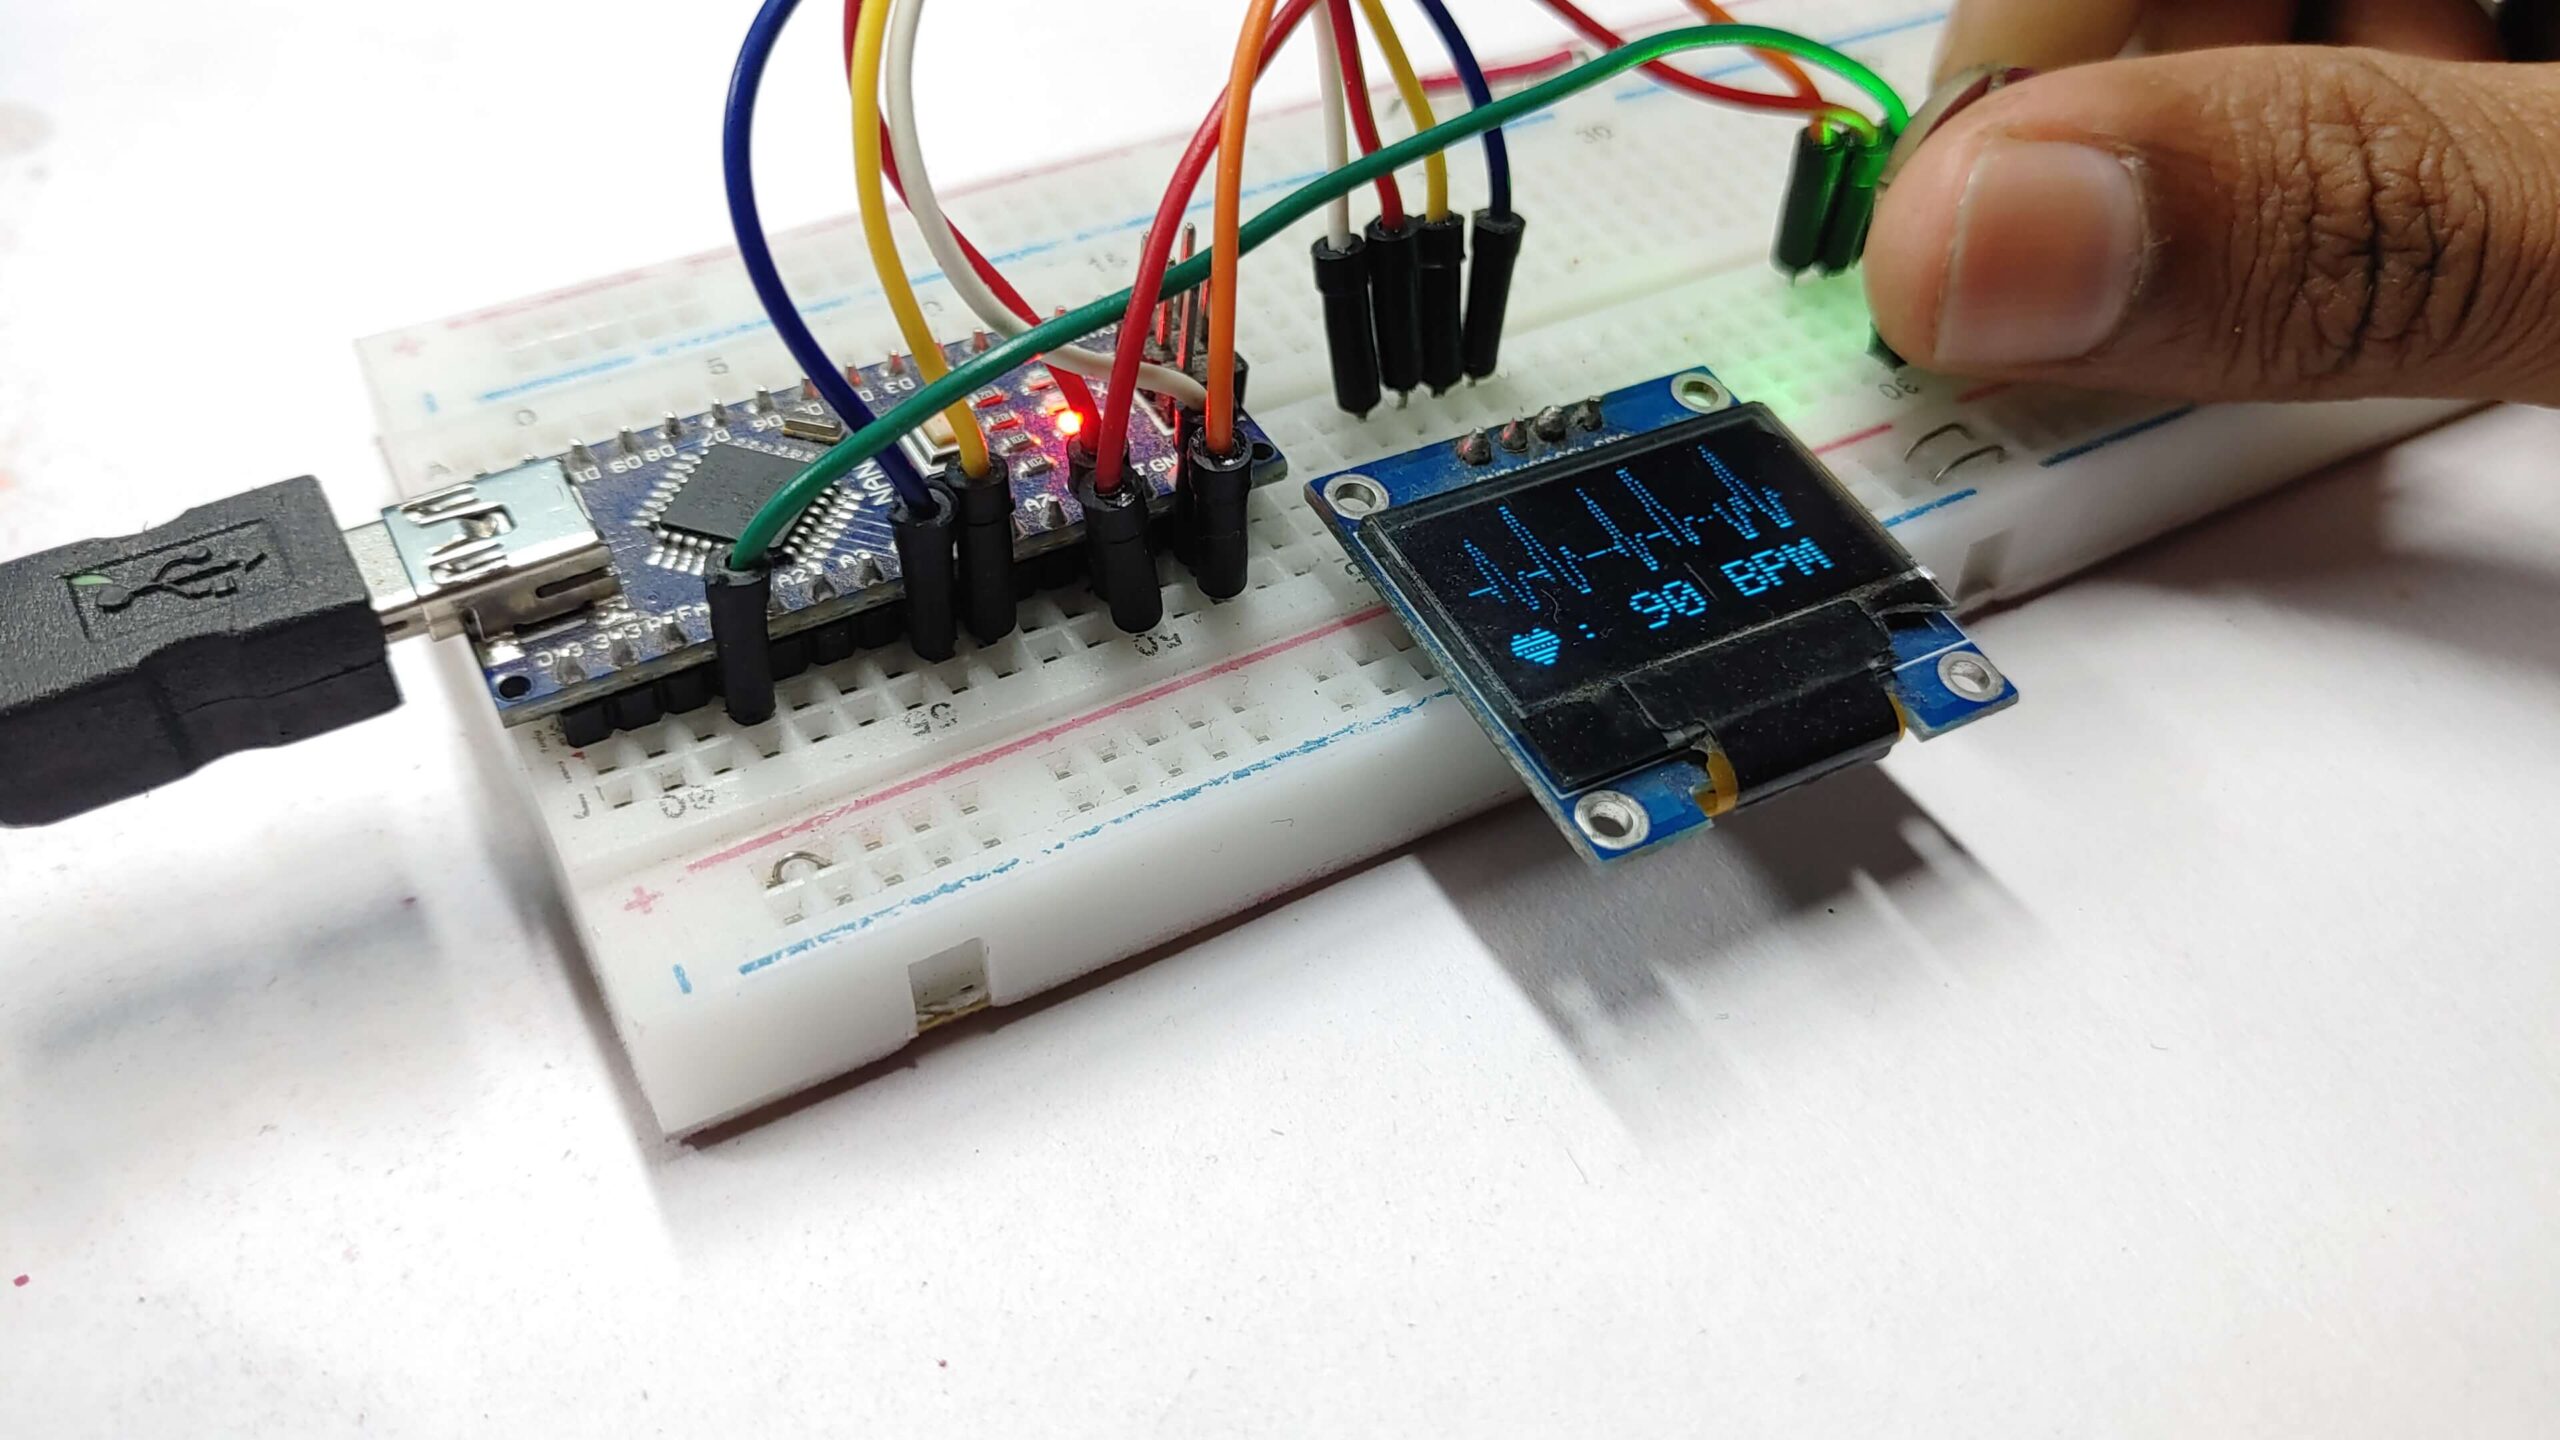
Use a 0.96″ I2C OLED display for standalone operation. Install the Adafruit SSD1306 and Adafruit GFX libraries.
Wiring:
– OLED VCC → 5V
– GND → GND
– SCL → A5
– SDA → A4
Update your code to show BPM on screen instead of the Serial Monitor. This turns your prototype into a self-contained wearable device.
Trigger Alarms for Abnormal Readings
Program conditional statements to sound a buzzer or send alerts if BPM falls outside a safe range, such as below 50 or above 120 BPM. This feature is especially valuable for medical or infant monitoring applications.
Troubleshoot Common Issues
Fix No Readings or Zero BPM
Cause: Loose connections or unpowered sensor.
Solution: Double-check VCC and GND. Test power with a multimeter. Resolder any shaky header pins.
Pro Tip: Use colored wires, red for VCC and black for GND, to avoid wiring mistakes.
Eliminate Noisy Signals
Cause: Electrical interference or ambient light.
Solution:
– Add the RC filter (1kΩ + 0.1μF)
– Shield the sensor from bright lights
– Use twisted-pair wires for ECG leads
In code, implement averaging or digital filtering:
cpp

sensorValue = (analogRead(sensorPin) + analogRead(sensorPin)) / 2;
Handle Inconsistent Readings During Motion
Cause: Movement disrupts optical contact or ECG electrodes.
Solution:
– Secure the sensor tightly (use medical tape for ECG)
– For PPG, test on warm fingers. Cold reduces blood flow
– Add motion compensation algorithms in advanced versions
Optimize for Wearability and Reliability

Design a Comfortable Enclosure
A bare breadboard isn’t practical for daily use. Upgrade with:
– 3D-printed case for rigid protection
– Sewn fabric holder for LilyPad-based wearables
– Plastic boxes for stationary bedside monitors
Ensure buttons and displays remain accessible.
Switch to Battery Power
Replace USB cables with a 3.7V LiPo battery and charging module. For long runtime, use a low-power microcontroller like Arduino Pro Mini or ESP32 in deep sleep mode.
Add a power switch so the device doesn’t drain overnight.
Improve Signal Stability
- Use shielded cables for ECG leads
- Apply conductive gel to electrodes
- For PPG, press the sensor firmly against fleshy tissue (fingertip or earlobe)
Test across different users. Skin tone, temperature, and hydration affect readings.
Expand With Advanced Features
Enable Wireless Alerts (IoT)
Replace Arduino Uno with ESP32 or ESP8266. Program it to:
– Connect to Wi-Fi
– Send BPM to a web dashboard
– Trigger email or SMS alerts if heart rate exceeds safe limits
Use platforms like Blynk, ThingSpeak, or IFTTT for easy integration. Raspberry Pi also works well for IoT projects requiring complex data logging.
Add Bluetooth Data Logging
Pair with an HC-05 Bluetooth module or use ESP32’s built-in BLE. Send BPM to a smartphone app for long-term tracking. Great for fitness or sleep studies.
Combine with Other Sensors
Create a multi-parameter health monitor by adding:
– Temperature sensor (e.g., DS18B20)
– Accelerometer (e.g., MPU-6050) for activity tracking
– Muscle sensors (EMG) to detect contractions
– Gas sensors for environmental hazard detection
Fused data gives deeper insights into cardiovascular health.
Validate Accuracy and Performance

Test Against Commercial Devices
Compare your monitor’s readings with a smartwatch or hospital pulse oximeter. Take measurements at rest, during exercise, and recovery.
Acceptable variance: ±5 BPM for PPG, ±2 BPM for ECG.
Benchmark Key Metrics
| Metric | Target Value |
|---|---|
| BPM Range | 30–240 BPM |
| Signal Frequency | 0.5Hz – 4Hz |
| Sampling Rate | ≥50 Hz |
| Response Time | <3 seconds |
| Power Consumption | <50 mA (wearable) |
| Signal-to-Noise Ratio | High (clean waveform) |
Use these to evaluate whether your build meets functional goals.
Conduct Real-World Trials
Test with:
– Different users (age, skin tone, fitness level)
– Various lighting conditions
– Light movement (walking, typing)
Document issues and refine the design iteratively.
Finalize and Iterate
Document Your Build
Keep a log of:
– Component list and wiring diagram
– Code versions and calibration settings
– Test results and user feedback
This helps replicate or improve the design later.
Plan Version 2.0
Common upgrades include:
– Smaller form factor
– Longer battery life
– Waterproofing
– Smartphone app integration
– Fall detection or anomaly alerts
Each iteration brings your DIY heart rate monitor closer to commercial quality.
Frequently Asked Questions About Building a Heart Rate Monitor
What is the difference between PPG and ECG heart rate sensors?
PPG uses light to detect blood volume changes under the skin, making it ideal for wrist or fingertip wearables. ECG measures the heart’s electrical signals through electrodes, offering higher accuracy and better performance during motion. PPG is simpler for beginners, while ECG is preferred for medical-grade applications.
Which microcontroller is best for a beginner heart rate monitor project?
The Arduino Uno R3 is the best choice for beginners. It offers extensive community support, easy programming, and plug-and-play compatibility with most sensors. For wearable projects, the LilyPad Arduino provides sewable pins that work with conductive thread.
How accurate is a DIY heart rate monitor compared to commercial devices?
A well-calibrated DIY PPG monitor typically achieves accuracy within ±5 BPM of commercial devices, while ECG-based builds can reach ±2 BPM. Accuracy depends on sensor contact quality, threshold calibration, and motion compensation. Testing against a smartwatch or pulse oximeter helps verify performance.
What causes noisy signals in optical heart rate sensors?
Noisy signals typically result from electrical interference, ambient light, or poor skin contact. Adding an RC filter (1kΩ resistor and 0.1μF capacitor), shielding the sensor from bright lights, and ensuring firm contact on fleshy areas like the fingertip or earlobe significantly improves signal quality.
Can I make my heart rate monitor wireless?
Yes. Replace the Arduino Uno with an ESP32 or ESP8266 board that has built-in Wi-Fi, or add an HC-05 Bluetooth module. This allows you to send BPM data to a smartphone app, web dashboard, or trigger email and SMS alerts when readings exceed safe limits.
How long does it take to build a basic heart rate monitor?
A simple PPG-based fingertip monitor with an Arduino can be assembled in a few hours, including wiring and basic code upload. Adding an OLED display, battery power, or custom PCB enclosure may extend the project to a weekend. ECG builds require more time due to electrode setup and signal filtering.
Key Takeaways for Your DIY Heart Rate Monitor Build
Building a heart rate monitor is more than a tech project; it is a gateway to understanding biometrics, signal processing, and wearable design. Start simple with an optical sensor and Arduino, master the basics, then scale up to ECG or IoT-connected systems. With accessible tools and open-source libraries, anyone can create a functional, insightful device. Your heartbeat is data, and now you know how to capture it.